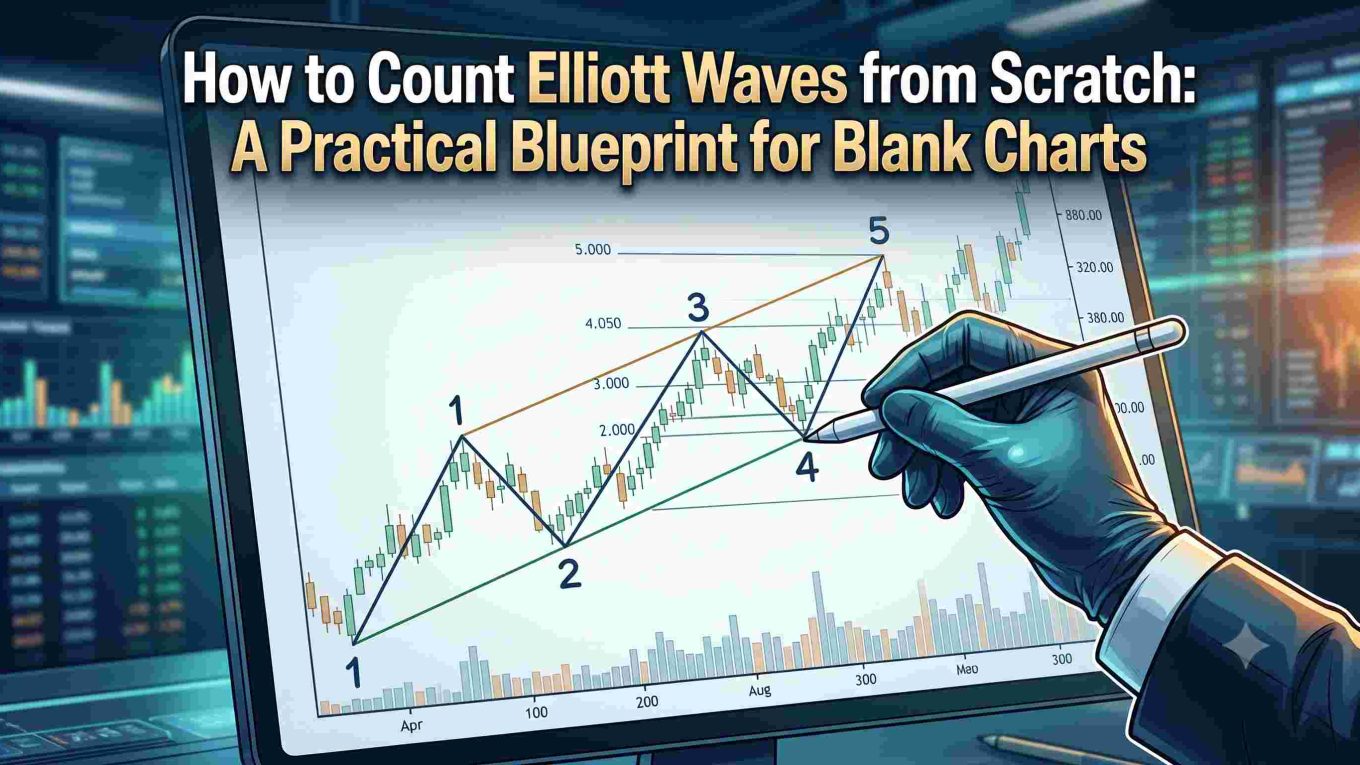
How to Count Elliott Waves from Scratch: A Practical Blueprint for Blank Charts
Opening a blank chart with the intention of applying wave theory can feel paralyzing. Without existing trendlines or indicators, the screen looks like a chaotic sea of green and red candles.
The biggest mistake traders make is zooming straight into a 5-minute or 15-minute chart and forcing a 5-wave impulse onto random intraday noise. If you want consistent, objective results, learning how to count Elliott waves requires a disciplined, top-down workflow rather than arbitrary guesswork.
Here is a practical, step-by-step roadmap to go from a clean canvas to a high-probability market structure.
👉 “For a step‑by‑step approach to spotting the first impulse wave, see Identify Wave 1 in Elliott Wave.”
Anchor to Macro Extremes (Top-Down Approach)
A valid wave count never starts in the middle of a consolidation. To master how to count Elliott waves from scratch, you must always anchor your analysis to an unambiguous market extreme.
- Start on the Monthly or Weekly Chart: Zoom out until you can see multi-year price history.
- Identify Major Pivots: Look for the absolute all-time high, a major multi-year low, or a clean breakout from a long-term base. This structural extreme serves as your Cycle Zero (0)—the baseline reference point for all subsequent counts.
- Filter Out the Noise: Ignore individual candle wicks or short-term volatility. Focus solely on large directional swings and multi-month corrective phases.
👉 “A deeper dive into corrective price action is available in Foundation of Corrective Price Action.”
When measuring the pullback following Wave 3, refer to our detailed breakdown on Wave 4 retracement depth limits to verify whether a 50% or 61.8% dip breaks the count or remains structurally valid.
Separate Motive Trends from Corrective Choppiness
Every price move falls into one of two categories: Motive (trending) or Corrective (consolidating). Learning to spot the difference at a glance saves hours of second-guessing when mapping your structure.
| Characteristic | Motive (Trending) | Corrective (Consolidating) |
|---|---|---|
| Price Action | Clean, steep, directional | Choppy, sideways, overlapping |
| Internal Structure | 5 waves (1-2-3-4-5) | 3 waves (A-B-C) or complex combinations |
| Pullback Depth | Shallow relative to the advance | Deep, sharp, or drawn-out retracements |
| Momentum | Sustained expansion in RSI / MACD | Frequent divergences and flat midlines |
Scan forward from your macro pivot. If price surges without overlapping previous legs, you are looking at a potential 5-wave impulse. If price continually chops back into previous candle ranges, treat it as a corrective consolidation.
👉 “Beginners can strengthen their basics with Dow Theory — The Definitive Guide.”
Find the Anchor: Wave 3
When learning how to count Elliott wave cycles, do not waste time trying to spot Wave 1 first. Wave 1 usually looks like a standard counter-trend bounce and is easy to mislabel.
Instead, look for Wave 3—the most aggressive, unmistakable directional advance on the chart.
- Key Wave 3 Signs: It features the widest candle bodies, the steepest angle of ascent, heavy volume expansion, and momentum indicators (like RSI) pinned in overbought or oversold zones.
- Map Outward from Wave 3: Once you isolate the powerhouse Wave 3, work backward to locate the base (Wave 1 and the corrective trough of Wave 2). Then, project forward to anticipate the corrective consolidation of Wave 4 and the final push of Wave 5.
👉 “Institutional players often exploit false breakouts — see Candlestick Patterns: False Breakouts.”
Check the 3 Inviolable Cardinal Rules
Before getting excited about a trade setup, run your proposed count through three non-negotiable rules. If even one rule is broken, the count is invalid—throw it out and start over.
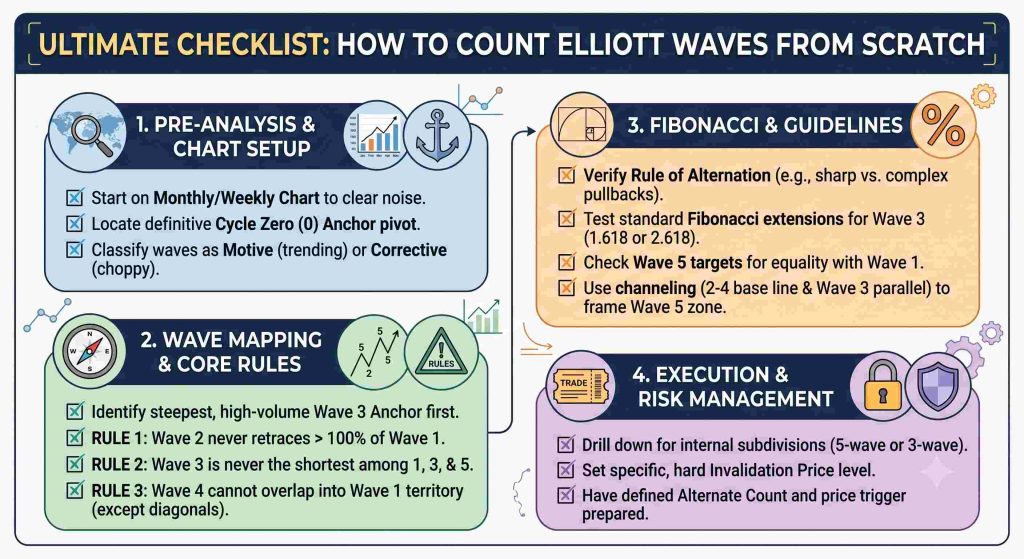
- Rule 1 (Wave 2 Retracement): Wave 2 can never retrace more than 100% of Wave 1. A break below the start of Wave 1 invalidates the count immediately.
- Rule 2 (Wave 3 Length): Wave 3 is never the shortest wave among the motive legs (Waves 1, 3, and 5). It does not have to be the longest, but it cannot be the shortest.
- Rule 3 (Wave 4 Territory): Wave 4 can never enter the price territory of Wave 1 (no overlap between the low of Wave 4 and the high of Wave 1 in an uptrend). The only exception occurs in diagonal triangle patterns.
Verify Structure with Fibonacci Ratios and Alternation
Once your count passes the cardinal rules, check whether the proportions make market sense.
The Rule of Alternation
The market rarely repeats the exact same corrective pattern back-to-back:
- If Wave 2 is a fast, deep zigzag (retracing 50% to 61.8%), Wave 4 is likely to be a prolonged, sideways flat or triangle (retracing 23.6% to 38.2%).
- If Wave 2 is complex and shallow, expect Wave 4 to be sharp and steep.
Standard Fibonacci Targets
Use standard Fibonacci extensions and retracements to verify targets:
- Wave 3 Target: Often reaches 1.618 x Wave 1, or extends to 2.618 x Wave 1 in strong momentum environments.
- Wave 5 Target: When Wave 3 extends, Wave 5 frequently equals the length of Wave 1 (Wave 5 = Wave 1).
- Channeling Check: Draw a trendline connecting the ends of Wave 2 and Wave 4. Project a parallel trendline from the peak of Wave 3. Wave 5 typically terminates near or slightly beyond this upper trendline.
Drill Down and Define Risk
Now that your macro structure is locked in, drop down to the Daily, 4-Hour, or 1-Hour chart to verify internal subdivisions (i-ii-iii-iv-v inside motive waves and a-b-c inside corrective legs).
To trade wave counts profitably, manage your charts with disciplined risk rules:
- Identify the Invalidation Level: Every primary count must have a clear price level that invalidates the setup. For example, if you are trading an anticipated Wave 3 breakout, a drop below the low of Wave 2 kills the thesis. Exit immediately if this level is breached.
- Carry an Alternate Count: Markets present multiple possibilities. Always track a primary thesis alongside a secondary scenario (for instance: Primary Count = developing Wave 3 impulse; Alternate Count = larger Wave B flat correction). Know the exact price level that forces you to switch from primary to alternate.
Starting from long-term extremes and applying strict elimination rules strips away subjectivity. Once you know how to count Elliott wave structures systematically, a blank chart stops being intimidating and turns into a clear, probability-backed roadmap.
End Note
Mastering wave analysis on a blank chart is an exercise in disciplined elimination. By anchoring to higher-timeframe extremes and isolating the clear momentum of Wave 3, you eliminate the noise that traps traders on lower timeframes. Validating the advance through cardinal rules and Fibonacci proportions transforms ambiguous price action into an objective roadmap.
The real edge lies in risk control. Because markets offer multiple paths, setting an explicit invalidation price and tracking a viable alternate count are mandatory. When you trade the structure rather than your bias, the blank canvas becomes an asymmetric framework for capturing high-probability trends.
Author Bio
Suyesh Gusain is an equity derivatives researcher, technical analyst, and founder of WisdomGanga. He specializes in Elliott Wave Theory, NEoWave, and quantitative market analysis, with an emphasis on systematic risk management and trading psychology.
Enjoyed the article? Help us spread awareness by sharing it with your network.
Stay connected and join the conversation:
- Follow us on Facebook
- Connect with us on Instagram
- Join us on Twitter/X
- Explore more insights on Instagram
Your support helps us reach more readers and build a stronger community.
Frequently Asked Questions
How do to count Elliott waves on a blank chart?
To count waves on a blank chart without getting misled by noise, apply a strict top-down process. Start on the monthly or weekly chart to establish historical reference points (Cycle Zero) at multi-year highs, lows, or major base breakouts. From there, distinguish directional trending moves from overlapping corrective action.
Rather than guessing the first move, locate the steepest momentum leg (Wave 3) first, then work backward to map Waves 1 and 2, and forward to map Waves 4 and 5. Once the macro structure aligns with orthodox Elliott Wave rules, drop to daily or 4-hour charts to track internal subdivisions.
How to identify Wave 3 in Elliott wave structures?
Wave 3 is the most powerful and unambiguous phase of an impulse sequence. To identify it, look for:
Momentum and Slope: The steepest angle of ascent or descent on the chart, featuring large, consecutive candle bodies with minimal pullbacks.
Volume Expansion: Substantial, sustained trading volume confirming institutional participation.
Indicator Extremes: Oscillators like RSI or MACD surging to peak values without bearish divergence.
Proportional Extension: In equities, Wave 3 typically measures at least 1.618 times the length of Wave 1, and often extends to 2.618 times Wave 1 in strong trends.
What are the essential Elliott wave rules for beginners step by step?
Every valid 5-wave impulse must satisfy three non-negotiable cardinal rules before you consider trading it:
Rule 1 (Wave 2 Retracement): Wave 2 can never retrace more than 100% of Wave 1. If price breaches the origin of Wave 1, the count is instantly invalid.
Rule 2 (Wave 3 Length): Wave 3 is never the shortest wave among the motive waves (Waves 1, 3, and 5). It does not have to be the longest, but it cannot be the shortest.
Rule 3 (Wave 4 Territory): Wave 4 can never enter the price territory of Wave 1 (no overlap between the Wave 4 extreme and the Wave 1 peak/trough), except within leading or ending diagonal patterns.
How to find Wave 1 and 2 in Elliott wave sequences?
Finding Waves 1 and 2 requires waiting for structural confirmation rather than picking exact bottoms or tops:
Locating Wave 1: Look for a 5-wave micro-breakout that snaps a multi-month trendline or exits a prolonged accumulation base. Because it emerges out of a prior trend, Wave 1 often looks like a deceptive counter-trend rally.
Locating Wave 2: Once the 5-wave structure of Wave 1 completes, watch for a 3-wave corrective pullback (A-B-C). Wave 2 typically retraces 50% to 61.8% of Wave 1 on declining volume. The setup is confirmed when price holds strictly above the Wave 1 origin and begins accelerating past the Wave 1 pivot.
How to know if an Elliott wave count is invalid?
An Elliott Wave count is invalidated whenever price action violates core structural rules or key structural pivots:
Rule Violations: Wave 2 dropping below the start of Wave 1, Wave 4 closing inside Wave 1 territory (in a standard impulse), or Wave 3 ending up shorter than both Waves 1 and 5.
Time and Alternation Failures: If Wave 4 takes an abnormally long time compared to Wave 2, or fails to alternate in structure (e.g., repeating identical simple pullbacks), the pattern is likely part of a larger complex correction rather than a clean impulse.
Pre-Set Invalidation Triggers: Professional analysts always attach an exact invalidation price to every count (such as the low of Wave 2 or the pivot of Wave 4). If that price is triggered, discard the primary scenario immediately and switch to your alternate count.