
The Blank Chart Problem: How to Accurately Identify and Anchor Wave 1 in Elliott Wave Theory
Every technical analyst eventually encounters the blank chart paralysis. In classic textbooks, Elliott Wave cycles look pristine: five fluid upward waves followed by a tidy three-wave corrective pullback.
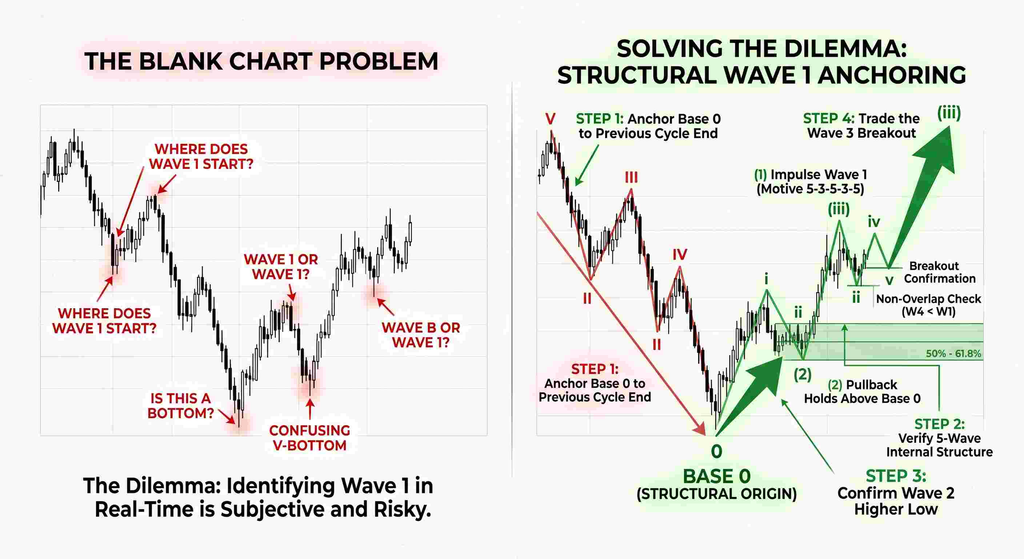
Strip away hindsight, indicators, and historical labels, however, and live price action feels entirely different. Market participants routinely freeze on the same fundamental question: Where does Wave 1 actually begin?
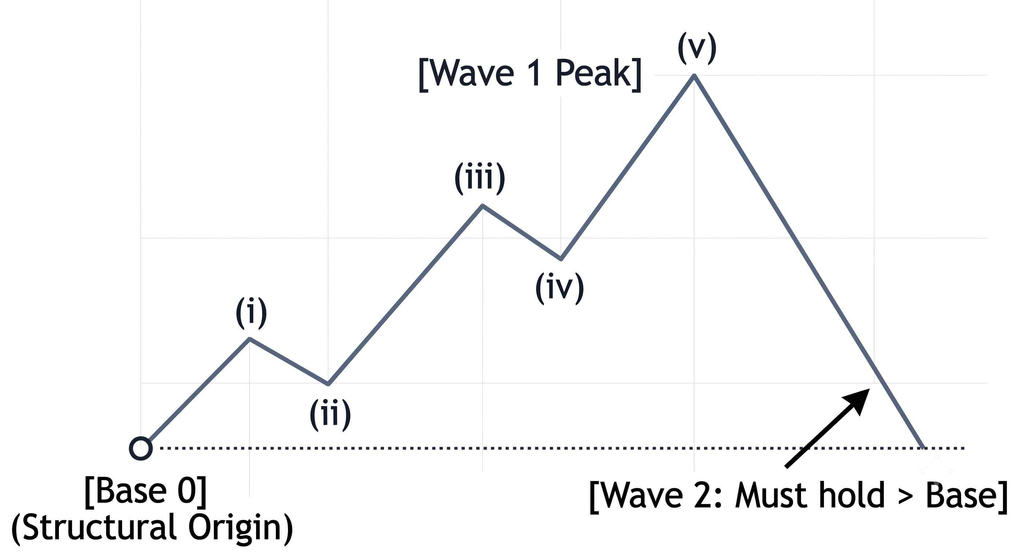
The most expensive mistake in wave analysis is trying to pick the absolute bottom tick in real time and calling it Wave 1. In institutional trading practice, Wave 1 is rarely caught at inception. It is observed, deconstructed into sub-waves, and confirmed only after Wave 2 prints a protected higher low.
Understanding how to isolate the base origin point of Wave 1 transforms subjective chart reading into an objective, rule-based execution strategy.
1. Finding the True Base: Structural Termination vs. Price Extremes
Before analyzing individual green candles on an intraday timeframe, establish higher-timeframe context on the Daily or Weekly chart. Wave 1 can only begin where the preceding corrective cycle officially terminates.
The Orthogonal Low Trap
Traders often assume that Wave 1 begins at the absolute lowest wick on the chart. In standard Zigzag corrections, this is frequently true. However, in non-standard or complex corrective patterns, the lowest price point is not necessarily the structural end:
- Running Flats: Wave B drives prices to a new extreme low, but Wave C terminates higher. The real structural origin of the subsequent Wave 1 is the completion point of Wave C, not the extreme wick of Wave B.
- Contracting & Expanding Triangles: Wave E frequently falls short of previous swings or overshoots briefly on a liquidity sweep. The new motive cycle begins strictly at the conclusion of Wave E.
- Truncated Wave 5s: In an exhausting bear market, Wave 5 may fail to break the low of Wave 3. The origin point is that failure low, not an arbitrary support level.
Always anchor Base 0 to the pattern’s formal conclusion, not just raw price extremes.
2. Microstructure Validation: Dissecting the Anatomy of Wave 1
Once a potential Base 0 is marked, drop down to an intermediate timeframe (such as the 1-hour or 15-minute chart) to evaluate the initial rally. A legitimate Wave 1 must sub-divide into an unambiguous motive structure.
Impulse Wave 1 Sub-waves:

        (iii)
        /   \
      (i)   (iv)
      / \   /  \
     /  (ii)    \
Base 0           (v) -> [Wave 1 Top]
Impulse vs. Leading Diagonal vs. Counter-Trend Traps
| Technical Metric | Standard Impulse Wave 1 | Leading Diagonal Wave 1 | Corrective Counter-Trend (Wave B / X Trap) |
| Internal Subdivision | 5–3–5–3–5 | 5–3–5–3–5 or 3–3–3–3–3 | 3–3–5 (Flat) or 5–3–5 (Zigzag) |
| Wave 4 & 1 Overlap | Strictly Forbidden | Required / Common (Wedge shape) | Frequent, persistent overlap |
| Price Velocity | Decisive displacement through local supply | Slower, contracting range | Choppy, weak follow-through |
| Volume Signature | Expanding volume on sub-wave (iii) | Typically diminishing toward apex | Fades rapidly during the advance |
If the initial thrust upward cannot be broken down into five distinct fractal movements, discard the Wave 1 thesis immediately. It is likely a corrective bounce (Wave B or Wave X) set to roll over into fresh lows.
3. Filtering Traps: Distinguishing Wave 1 from Bear Rallies
In a persistent downtrend, aggressive counter-trend rallies mimic early impulse moves. Two structural filters separate a genuine change in trend from a bear-market trap:
- The Base Channel Breakout: Draw a corrective trendline connecting the zero-point to Wave B, or Wave 2 to Wave 4 of the preceding down-structure. A true Wave 1 breaks this channel decisively in less time than it took the final corrective leg to print.
- Momentum Divergence at the Base: The terminal wave leading into Base 0 should display pronounced bullish divergence on momentum oscillators like the Relative Strength Index (RSI) or MACD. If momentum was accelerating downward into the low, the odds favor ongoing trend continuation rather than an immediate Wave 1.
4. The Confirmation Protocol: Validating via Wave 2
Wave 1 remains an unconfirmed hypothesis until the subsequent market pullback—Wave 2—completes according to strict Elliott Wave rules.
- The Invalidation Rule: Wave 2 can retrace 50%, 61.8%, 78.6%, or even 99% of Wave 1, but it can never retrace 100%. A single tick breach below Base 0 completely invalidates the count.
- Internal Nature of Wave 2: Wave 2 must develop as a three-wave corrective sequence (A-B-C), such as a zigzag, flat, or complex combination. If the pullback unfolds in a sharp five-wave impulse, the preceding move was not a Wave 1.
- Volume Depletion: While sub-wave (iii) of Wave 1 displays an influx of institutional participation, volume should dry up visibly as Wave 2 pulls back toward key Fibonacci support zones.
5. Step-by-Step SOP: How to Count from a Blank Chart
To establish an Elliott Wave count on any asset without cognitive bias, follow this repeatable process:
- Step 1: Top-Down Cycle Identification Zoom out to the Weekly and Daily charts. Map out the dominant macro trend and confirm whether the prior bear phase completed its minimum pattern requirements (e.g., five waves down or a completed A-B-C structure).
- Step 2: Pinpoint Base 0 Identify the pattern completion pivot. Verify whether the terminal end aligns with an absolute low or a complex corrective finish (e.g., truncated 5th, running flat C-wave). Mark this level as
Base 0. - Step 3: Drop Two Timeframe Degrees Shift from Daily to 1-Hour or 15-Minute view to analyze the internal dynamics of the first leg up.
- Step 4: Check for Motive Subdivision Count the internal waves of the thrust. Confirm five non-overlapping sub-waves (i-ii-iii-iv-v) or a clean converging wedge (Leading Diagonal).
- Step 5: Track the Corrective Retracement Wait for the market to form a three-wave corrective structure (a-b-c). Mark key Fibonacci levels ($50\%$ and $61.8\%$) relative to the candidate Wave 1.
- Step 6: Trigger the Setup on Wave 3 Ignition Leave labels provisional (
(1)and(2)) until price breaks above the swing high of sub-wave b of Wave 2, or clears the absolute peak of Wave 1. Risk is clearly defined belowBase 0, providing a high-probability asymmetric entry into the most explosive phase of the cycle: Wave 3.
Conclusion
Mastering the blank chart comes down to abandoning the urge to forecast market bottoms in real time. Elliott Wave analysis is not an exercise in prophetic market timing; it is a discipline of structural confirmation and asymmetric risk management. By anchoring your analysis to pattern terminations rather than arbitrary wicks, requiring five-wave motive proof, and demanding that Wave 2 respect its origin boundary, you eliminate guesswork from the equation.
Wave 1 is merely the market’s opening statement—an alert that institutional sentiment may be shifting. Let the market prove its intent first. Once the base is validated and the higher low is locked in, you step out of the fog of prediction and into high-probability execution right as Wave 3 ignites.
Author Bio
Suyesh Gusain is an equity derivatives researcher, technical analyst, and founder of WisdomGanga. He specializes in Elliott Wave Theory, NEoWave, and quantitative market analysis, with an emphasis on systematic risk management and trading psychology.