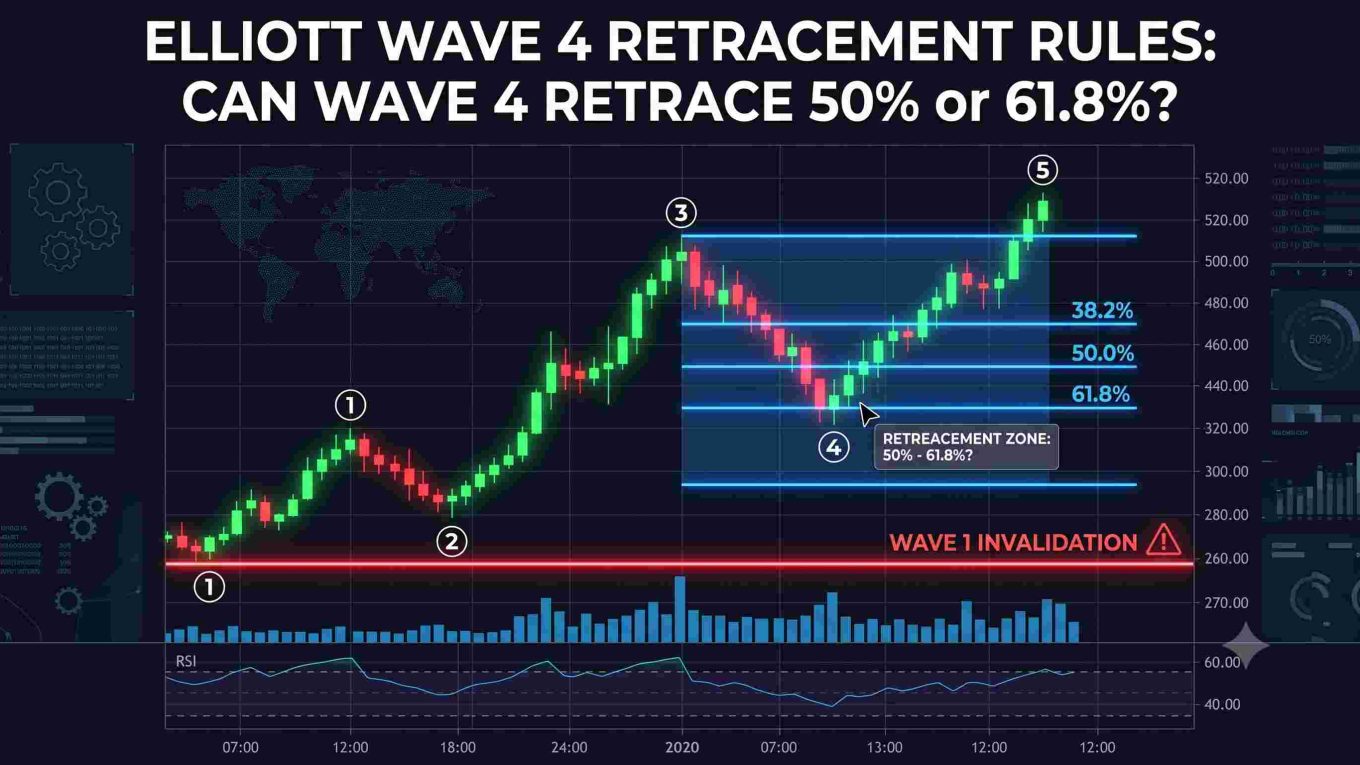
Elliott Wave 4 Retracement Rules: Can Wave 4 Retrace 50% or 61.8%?
One of the most frequent dilemmas traders face when mapping an impulse structure is evaluating the depth of Wave 4. When a pullback slices cleanly past typical Fibonacci supports, it triggers immediate doubt: Can Wave 4 retrace 50 percent or 61.8% of Wave 3, or is the entire count broken?
If you are already familiar with how to count Elliott waves from scratch, you know that understanding the exact boundary between an inviolable rule and a flexible guideline is what separates consistent wave analysts from traders stuck in analysis paralysis.
The Core Rule: What Is the Maximum Retracement for Wave 4?
The maximum retracement for Wave 4 is defined structurally, not by a fixed Fibonacci percentage. In orthodox Elliott Wave Theory, only one non-negotiable rule governs Wave 4 depth:
The Wave 4 Overlap Wave 1 Rule: In a standard 5-wave impulse, Wave 4 can never enter the price territory of Wave 1.
- In an uptrend, the low of Wave 4 must remain strictly above the extreme high of Wave 1. (If you struggle to locate where the move originated, review how to identify Wave 1 on a blank chart).
- In a downtrend, the high of Wave 4 must remain strictly below the extreme low of Wave 1.
If price ticks even one pip or point into Wave 1 territory, the move ceases to be a valid standard impulse. This breakdown in higher-high and higher-low progression mirrors the classic market structure outlined in Dow Theory for beginners. The only exception to this rule occurs within diagonal triangles (leading or ending diagonals), where wave overlap is a recognized structural feature.
Can Wave 4 Retrace 50 Percent or 61.8% of Wave 3?
Yes, it is mathematically legal for Wave 4 to retrace 50% or even 61.8% of Wave 3, provided the wave 4 overlap wave 1 rule is strictly respected.
However, context determines whether a deep pullback is legitimate or a major warning sign:
| Retracement Level | Structural Expectation | Practical Context |
|---|---|---|
| 23.6% – 38.2% | Standard & Expected | Healthy impulse; strong institutional momentum; eager dip-buying. |
| 50.0% | Permissible | Occurs when Wave 1 was compressed, or Wave 4 forms a complex expanded flat. |
| 61.8% | Rare / Borderline | Permissible only if Wave 1 was very short. High probability of count failure. |
| > 61.8% | Structurally Suspect | Almost always overlaps Wave 1 or signals a macro trend reversal. |
When a 50% or 61.8% Retracement Is Allowed
A deep retracement can validly unfold under two specific scenarios:
- Compressed Wave 1: If Wave 1 was small and Wave 3 underwent an explosive extension (such as 2.618 or 3.618 times Wave 1), a 50% or 61.8% pullback in Wave 4 may still sit comfortably hundreds of points above the Wave 1 peak.
- Expanded Flat Corrections: In an expanded flat, Subwave B sweeps the extreme of Wave 3, and Subwave C aggressively flushes liquidity below the low of Subwave A. Traders unfamiliar with the foundation of corrective price action frequently misinterpret this subwave C flush as an invalidation. In reality, institutions often engineer these moves using candlestick false breakouts to trap breakout traders before buying resumes.
Why a Deep Wave 4 Retracement Is a Red Flag
While a 50%+ pullback may not break orthodox rules on paper, deep retracements significantly degrade the probability of a healthy continuation:
- Loss of Institutional Momentum: Wave 3 represents peak market participation. If sellers can erase over half of that advance, the buying conviction driving the trend has degraded.
- Risk of a Truncated Wave 5: When Wave 4 retraces deeply, the market often lacks the energy to make a new structural high, leading to a truncated Wave 5 that fails to break the peak of Wave 3.
- Deep Wave 4 vs Complex Wave 2: If you observe a massive, vertical decline, you are rarely looking at Wave 4. More often, the initial rally was only Wave A of a larger correction, or the “Wave 3” was actually a B-wave trap within a continuing multi-month consolidation.
- Time Proportion Disparities: Beyond price depth, an authentic Wave 4 must maintain logical time proportions relative to Wave 2. Incorporating advanced concepts like NEoWave time and symmetry ensures you do not mistake a minor intraday dip for a full-scale Wave 4 consolidation.
The Rule of Alternation: Can Wave 4 Retrace More Than Wave 2?
Traders often ask: Can Wave 4 retrace more than Wave 2?
Yes, Wave 4 can retrace a larger percentage or point value than Wave 2, but doing so goes against the Rule of Alternation.
- Standard Behavior: Wave 2 is typically a sharp, deep correction (zigzag retracing 50% to 61.8%). Wave 4 alternates by unfolding as a shallow, prolonged sideways structure (flat, triangle, or double-three retracing 23.6% to 38.2%).
- Inverted Alternation: If Wave 2 was exceptionally shallow and sideways (common in runaway bull markets), Wave 4 will frequently alternate by being the sharp, deep correction of the cycle.
Practical Trading Framework: How to Handle a Deep Wave 4
To avoid getting caught in invalid counts, apply this checklist whenever Wave 4 dips past standard levels:
- Pin the Invalidation Anchor: Set your structural stop loss at the exact extreme of Wave 1. If price touches Wave 1, exit immediately. Never move a stop loss just because a Fibonacci ratio “should” hold.
- Track Internal Subdivisions: Verify whether the drop is a corrective 3-wave structure (A-B-C) or a decisive 5-wave impulsive decline. A 5-wave drop indicates a trend reversal, not a Wave 4 pullback.
- Monitor Subwave iv of 3: Orthodox Wave 4 pullbacks frequently terminate inside the price span of the previous fourth wave of lesser degree (subwave iv of 3). Use this zone alongside Fibonacci levels for confluence.
- Prepare the Alternate Count: If price drops past the 50% retracement of Wave 3, elevate your alternate count: the market may be completing a larger corrective B-wave or forming a leading diagonal.
By anchoring your analysis to the structural integrity of Wave 1 rather than arbitrary Fibonacci lines, you eliminate ambiguity and manage risk with complete objectivity.
Suyesh Gusain is a NISM-certified Research Analyst (Series XV) and Equity Derivatives trader (Series VIII), as well as Director at Wisdomganga. Combining a background in Physics and Mass Communication, he writes on advanced technical analysis, market microstructure, and digital fraud prevention to provide clear, actionable financial education.
Frequently Asked Questions
Can Wave 4 retrace more than 50 percent of Wave 3?
Yes, Wave 4 can mathematically retrace 50% or even 61.8% of Wave 3 without violating orthodox rules, provided it stays strictly above the price extreme of Wave 1. However, deep pullbacks are rare in healthy impulses. When Wave 4 retraces 50% or more, it typically reflects an extended Subwave C inside an expanded flat or signals that the broader directional impulse is exhausting, which raises the probability of a truncated Wave 5.
Can Wave 4 overlap Wave 1 in Elliott Wave?
In a standard 5-wave motive impulse, Wave 4 can never overlap into the price territory of Wave 1. If the low of Wave 4 in an uptrend breaches the peak of Wave 1 (or the high of Wave 4 crosses below the low of Wave 1 in a downtrend), the impulse thesis is invalidated. The only structural exception is within leading or ending diagonal patterns, where overlapping waves are an inherent characteristic of the wedge formation.
What is the maximum Fibonacci retracement level for Wave 4?
There is no fixed percentage cap for Wave 4; its true limit is structural (the origin and boundary of Wave 1). Historically and statistically, the standard retracement zone for Wave 4 is between 23.6% and 38.2% of Wave 3. While a 50% retracement is permissible when Wave 1 is compressed, pullbacks that exceed 61.8% almost always violate Wave 1 territory or point to a developing trend reversal rather than a valid fourth wave.
Why is my Wave 4 retracing so deep?
If your Wave 4 appears unusually deep, one of three structural events is typically occurring:
- Expanded Flat Correction: Subwave B swept past the peak of Wave 3, causing Subwave C to sell off aggressively below the low of Subwave A before completing.
- Misidentified Subwave 2: The steep drop may actually be Subwave C of an ongoing, complex Wave 2 correction, meaning Wave 3 has not yet started.
- Larger Degree Correction: The entire prior advance may have been a 3-wave corrective bounce ($A\text{-}B\text{-}C$) rather than a true 5-wave impulse, meaning the current sell-off is part of a larger macro downtrend.
How does Wave 4 deep retracement relate to Wave 2 alternation rules?
Elliott’s Rule of Alternation dictates that consecutive corrective waves within the same impulse should differ in character, depth, and duration. If Wave 2 was a sharp, rapid zigzag retracing 50% to 61.8%, Wave 4 should alternate by unfolding as a shallow, prolonged sideways consolidation (flat, triangle, or combination) retracing 23.6% to 38.2%. If Wave 4 instead carves out another deep, vertical drop, it violates the guideline of alternation and warrants reviewing alternate counts.